Why Google Analytics is crucial for personalisation
In my last post, we outlined the fundamentals of personalisation and how it can transform user experience on your site to drive more engagement and revenue.
If you missed it, catch up on how to get started with personalisation here.
Now let’s look at how to build the perfect data stack to harness all of this rich customer data and input into your chosen personalisation tool.
Building a data stack is like making cakes. A concoction of ingredients carefully combined, each with their own purpose. First you mix the key elements, then wait for the magic to happen, before decorating for that finishing touch.
It’s the combination of platforms that makes each of them work so well together – like chemistry. Remove one, or don’t set up the other correctly, and you end up with a sloppy mess.
Taking the time to set your data stack up correctly from the outset will ensure robust and accurate reporting, saving any headaches or confusion later.
This is especially important when it comes to reporting ROI across the business, and importantly, to the board.
Personalisation is complex enough as it is, so let’s not make it any harder than it needs to be, and get it right from the start.
Your personalisation data stack
1) The hub – a personalisation platform with split testing functionality.
This is the hub that all other tools connect to in order to work in harmony together. The motherboard. The tool that implements the personalisation onto your site – but it cannot work as well without the others.
There’s a wealth of personalisation tools on the market, each with their own benefits and limitations. The good news is we’ve done the hard work for you and put together a Personalisation Comparison Guide of the best on the market.
We’ve looked at analytics integrations, set-up ease and interface, split testing and content / product recommendations amongst other functionality.
And the bad news? Well... there is no bad news.
2) Data in - 1st and 3rd party data.
The personalisation tool needs to learn about your customer base, and it cannot do that without data.
Plug your own CRM, CMS, databases etc. into your chosen tool to set variants and segmentations with your first party data.
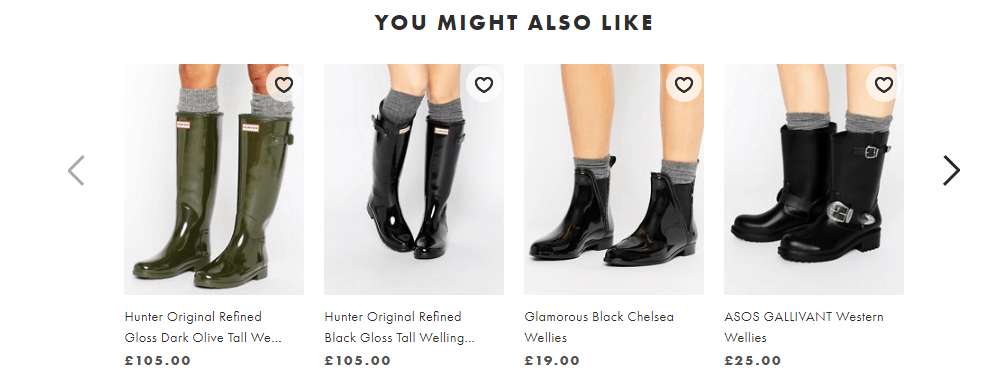
Third party integrations bring additional data streams to your own first party insight such as social logins, geolocation, interests and even the weather for a more intelligent approach to personalisation. An example of this would be showing raincoat product recommendations to someone in a location where it’s raining.
3) Data out – Analytics platform (Google Analytics)
Every tool has a purpose. The role of Google Analytics and other analytics add-ons is to measure the output of your personalisation, and link it to your business KPIs.

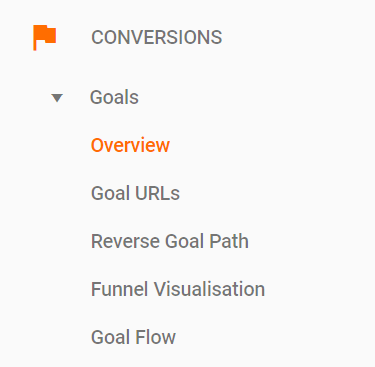
Make sure from the outset that your goals in GA are based on your KPIs – this means everything you track has a purpose, and can be linked directly back to business objectives. (More on this below).
The process
OK so you’ve chosen your personalisation tool, integrated your first and third party data, and plugged in your analytics platform.
What’s next?
Step 1 – a user comes to your site, and the personalisation tool checks the database to see if they’re eligible for any personalisation campaigns you’ll have set up, based on the data supplied.

Step 2 – the personalisation tool connects first and third party data about that user – previous shopping behaviour, browsing habits, social login, and chooses relevant content to show based on these factors. (i.e. products to go with their last purchase, or a blog about festivals if they’ve been browsing websites for wellies and tents).
Step 3 - Whatever happens with that user during that session in terms of their online behaviours (time on site, pages visited, user journey, etc.) – this is sent to the analytics platform, which you can then pull into your performance reports.
Step 4 – This insight is then fed back into the personalisation tool for future use and refinement the next time they visit the site. If you use Optimizely 360, Google’s industry-leading personalisation tool, this is done automatically. Or if you choose another tool you can pull your own reports and insights from your analytics programme and input back into the personalisation funnel. (Keep your eyes peeled for our personalisation tool comparison guide in the coming weeks).
Whichever tool you use, point is that the data gathered becomes the personalised content shown to that same user the next time they visit your site.
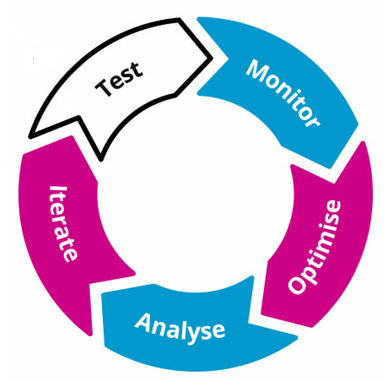
It’s a continual cycle of learning and refinement – underpinned and made possible by the integration of Google Analytics.
3 steps to analytics integration success
Mastering Google Analytics can be a complex and confusing process, but a bit of savvy set-up before you start tracking can make it that bit easier.
Understanding your business cycle and aligning chosen metrics to your own business goals means you can pull the exact story you want to tell from the data you create.
As discussed in my last piece on how to get started with personalisation, once you start to personalise content and then analyse what’s happening, you’ll discover so many more sub-groups of segments that are underperforming and therefore need more attention, or overperformers that you can capitalise on.
So what should you do for analytics success?
1) Goal setting & KPIs
We all know how hard it is to prove the value of our work to the board, with so much data available it can be a minefield to navigate.
Sometimes working backwards is the best way to combat this. It pays to think ahead to what type of story that you and senior stakeholders will want to see, such as average order value, revenue stream from a particular traffic source, or average blog views and time on page per user.
Define the story you need to tell, and then set up the right goals and KPI tracking within your analytics platform to be able to tell that story, and tell it with confidence.
As well as setting individual goals you can also create calculated metrics for more specific data – i.e. combining goals to create a new one, such as revenue / no. of conversions to give average order value.

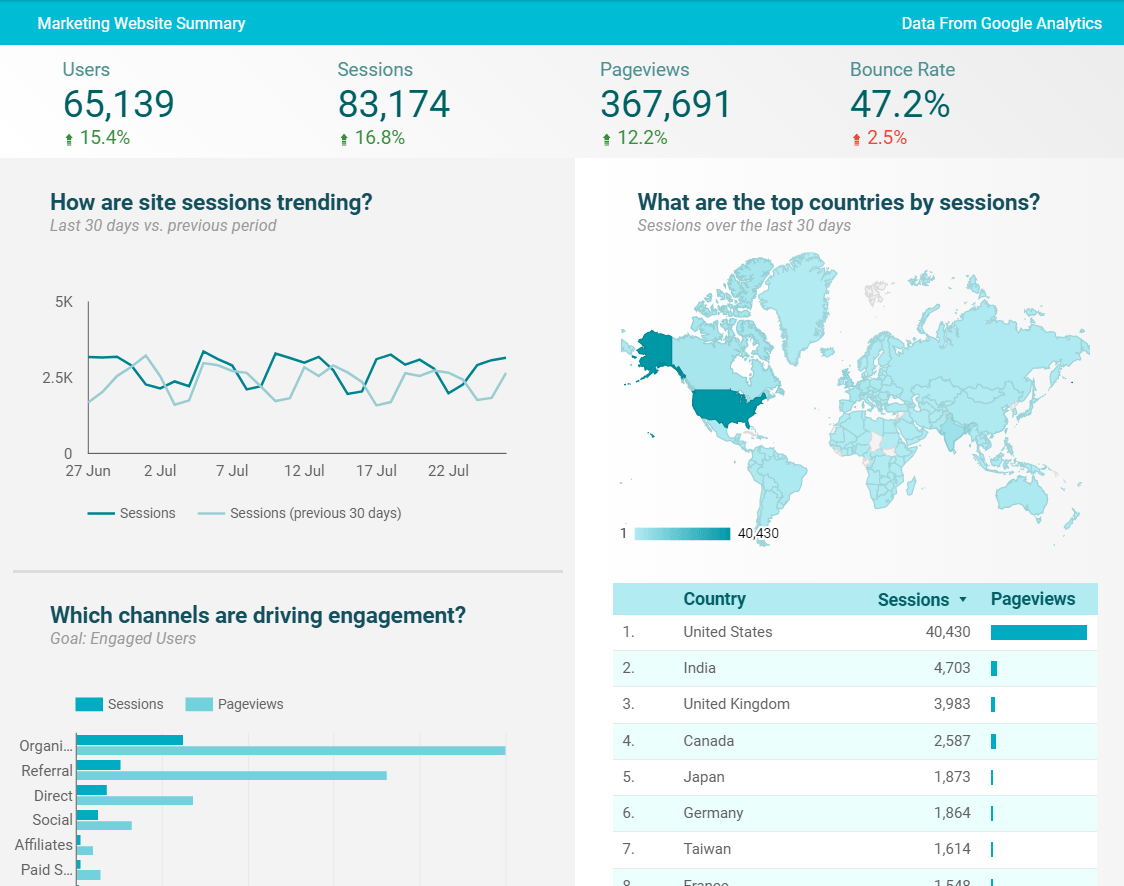
And because no one likes to trawl through Google Analytics to mine relevant data, make it easy for yourself and use Google Data Studio to create simple, visual reporting dashboards with the headlines that senior board members and stakeholders need to know.
2) Spring clean your data
It’s always better to tell the truth. The integrity of your data is fundamental to the accurate and reliable reporting across your business, especially in the case of personalisation.
Our data integrity audits make sure your data is consistent, dependable and true, so as not to distort your personalisation reporting.
3) Understand and optimise your business cycle
Like a fine wine, personalisation campaigns are best left to mature before you start to draw conclusions from it and take any actions.
The key to this is understanding your current business cycle in line with your proposed personalisation efforts.
Look at your existing cycle and think about the duration needed to get a fair test. Remember, personalisation is all about learning – a continual cycle of learning and refinement – and that takes time.

Allowing for a whole payday cycle, for example, which may well be a higher converting day, will give you a better birdseye view of your audience and make sure you don’t miss any potential variables that could have an affect on results.
In the early stages data is likely to fluctuate, so allowing it to normalise before reading trends will give a fair test and stop any false negative or positive readings.
Give it the time it deserves, avoiding any knee jerk reactions. You should be just as happy to learn by failing forward, because learning from it can only strengthen your marketing output – there is no negative.
In my next post, I'll be explaining how to use first and third party data for personalisation.