How to Track and Measure Page Performance in the New World Order of SEO

By Lee Colbran|2 Jan 2014
Content marketing, inbound marketing – the digital world has changed. SEO is no longer the buzz phrase of choice: it’s almost a dirty acronym now, associated with the manipulation of an algorithm. In a nutshell, Google wants more, it desires more and the simple task of busting in a gazillion links to inflate position is no longer an option.
So what happened? SEOs are suddenly changing their job titles.
In the New World Order of SEO, the SERPs are not consistent, nothing can be predicted, rank does not matter. We are now in the era of content and inbound marketing – a new breed of digital marketer has been born. It is time for SEO to grow up.
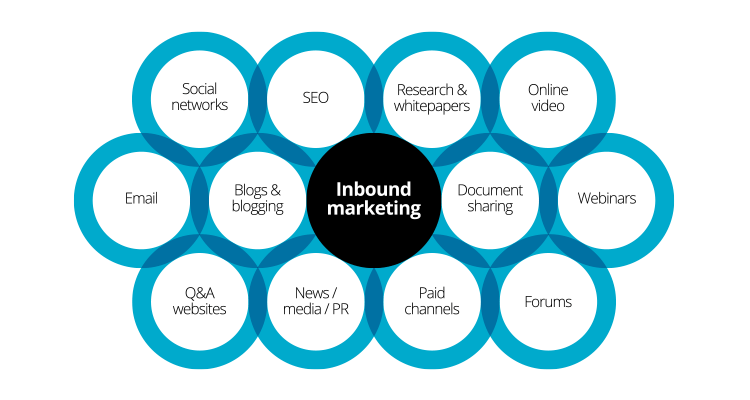
In light of this changing world, how can SEOs and digital marketers measure the performance of their hard work? If rankings are out the window, what can we use to show a page’s worth? In this blog post, I look at:
- How Google’s algorithms have changed the digital marketing game
- Remembering the real value of your users
- How to make your pages work harder
- Different paths to success
- The importance of layered goals for measuring page performance
- FREE downloadable page performance widget
How Google's algorithms have changed the digital marketing game
The long and short of it is this. If the sole tactic to gain leads is via organic-based search from Google, then it is always the situation that with a flick of a switch and a twist of a dial, visibility could be lost. If you rely solely on that visibility, losing it will result in loss of traffic, loss of conversions, and ultimately loss of revenue.
You only have to look at how the Venice update changed the localised search results for us all. Panda and Penguin were also seismic changes: no longer was thin content and mass link building accepted by Google. This had huge ramifications.
In my opinion, Venice was the real game changer – no longer could anyone claim to hold a position in the SERPs. If a site was appearing for a user searching for “plumbers” in Brighton, the likelihood is the results would now be significantly different for those searching for the same term in Blackpool. If you have not yet experienced the variance in search results from town to town, then you can do so with the Search Intent by Location plugin for Chrome, created by Dr David Sewell.
Forget rank and position: remember the real value of your users
So, after all that ranting, it leads us on to the meat and drink: ‘making the most of what you have’. And what is it we have? Visitors. No matter how few, it is vital to make sure that every visitor to a page of your site counts. In my opinion, there are not enough website owners who recognise the importance of this.
I’ll give you a comparison: you like someone, you flirt with them, you impress them, you get them interested and then once you have courted their attention, you lose interest. It all goes cold; it’s like all the effort that went before was just totally wasted. (We’ve all been there and done it, right?)
Well, in comparison (and with the exception of a few), the majority of us are guilty of digital neglect - welcome to the world of NOT looking after the visitors to your website!
Sadly, there are still too many people that are infatuated with rank and position. We already know these days are gone: personalisation, localisation and monetised Google products have engulfed the SERPs.
If you want to see how the front page of Google has evolved, then do take time to view the presentation below from Moz Marketing Scientist Dr Pete Meyers, Beyond 10 Blue Links: The Future of Ranking.
Making the most of what you have: how to make your pages work harder
So, the million dollar question: how can we track and measure the performance of a page on a website if search rank and position in the SERPs are not as reliable as they once were?
The first step to success is to know what it is the pages are trying to achieve. If there are no defined measures of success, then how do you know the traffic that is already being received is working intelligently? The chances are, what you already have can be working harder.
There are multiple elements that can be used to assess whether a page is successful.
Let’s take an ecommerce site as an example.
For an ecommerce site, the page breakdown will be something like:
- Homepage
- Category page
- Subcategory page
- Sub-subcategory page
- Product page
- User guide
Now you have your ecommerce website, it’s time to ask yourself the all-important question: what is it that you need to achieve from each page type?
If you cannot answer that question, then carry on reading. Even if you can answer, maybe it is time to apply a sense check and assess if your page performance objectives can be improved.
Which path is the real path to success?
So your page has attracted visitors, from a number of inbound marketing channels, awesome! Now what? You need to make each visitor count, that’s what.
As a marketer it is your responsibility to apply performance settings to the page in order to measure success. This is crucial when reporting back to the wider marketing team, a line manager, a director or possibly the board.
Example
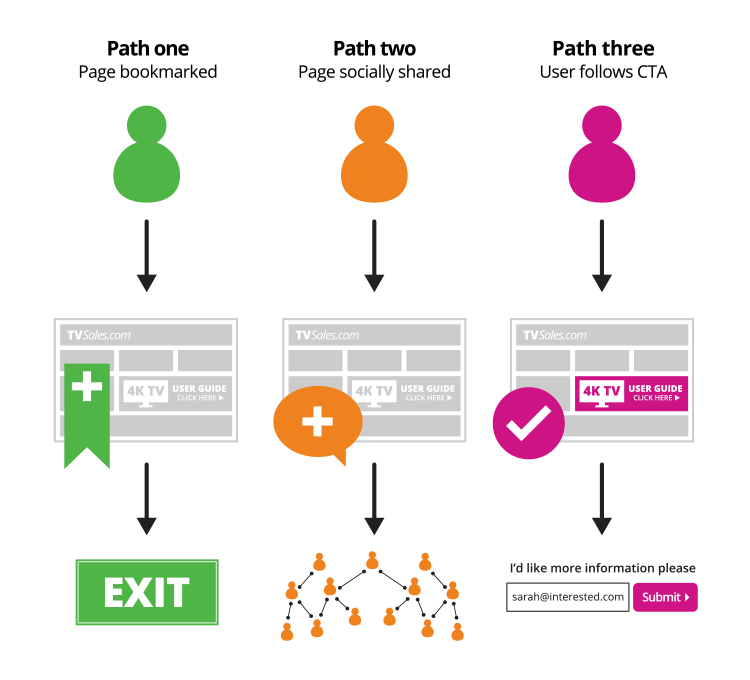
A popular page is a recently updated user guide on 4K TVs. Fantastic, visitors are coming on and reading the guide, but then what?
The following are all hypothetical scenarios that can be applied to applying success metrics to an individual page.
- Path one: Page is bookmarked and exit – An OK outcome, but we will have to rely on potential retargeting or paid advertising to draw the user back (unless they find further value content that has been created)
- Path two: Page is socially shared – A better outcome than a solitary bookmark: the link to the content appears in the user’s timeline and has been exposed to their social circle, offering additional eyeballs and subsequent brand awareness
- Path three: The user follows a CTA to sign up for more value-added information on 4K TVs. Secondary to purchase, this is a great outcome. The marketing team now have tangible information from which to apply lifetime value and create an extensive timeline
 Now ask the following question: What action is it that your organisation requires the user to make as they are reading the guide, or have completed reading the guide?
For many, the goal is to entice visitors to interact and at some stage make a purchase.
The buying cycle does of course differ for different products and services. For example, if a buyer was looking to buy the very latest 4K TV, there will be considerable research. After all, it’s a huge investment. While technology is new there is a great deal of education required for early adopters.
Gaining the trust of a visitor as they are reading a guide on 4KTV will hopefully impress upon them that your business is well placed to support their purchase based on the fact that your website has demonstrated that it is an authority on the subject.
Not only does the buying cycle differ from product to product, but purchase-influencing factors will differ from buyer to buyer. Some may look at pricing, others may look at reviews of the business, some will assess delivery information, service provision, etc.
Discussion of this is for another day. For now, we are concentrating on the main objective: getting the visitor to do what you need them to do!
Dependent on how aggressive the call to action is currently on your user guide, it is likely that more could be done to court the details of the user. For example, opinion could have been sought on what the visitor thought of the user guide. As a thank you for their cooperation, a voucher for free accessories could have been supplied for when they come to make the final purchase. At this time you collect an email address, which is absolute gold: you have the customer in the CRM system. The game is now yours to win (or lose)!
The importance of layered goals for measuring page performance
So then what? How do you know they are going to come back after the business has invested so much time and effort in getting them to view your proposition in the first instance?
This is where a scale of success for each page becomes crucial. If you cannot achieve the first objective then look at the second, the third, the fourth, the fifth – you get the point (hopefully).
When benchmarking performance, the following metrics can be used:
- Forward engagement
- Sale/enquiry
- Email/data collection
- Time spent on page
- Social share
- Bookmark
- Brand awareness
As the marketer it is your decision as to what metrics are important to your page.
Different pages, different objectives
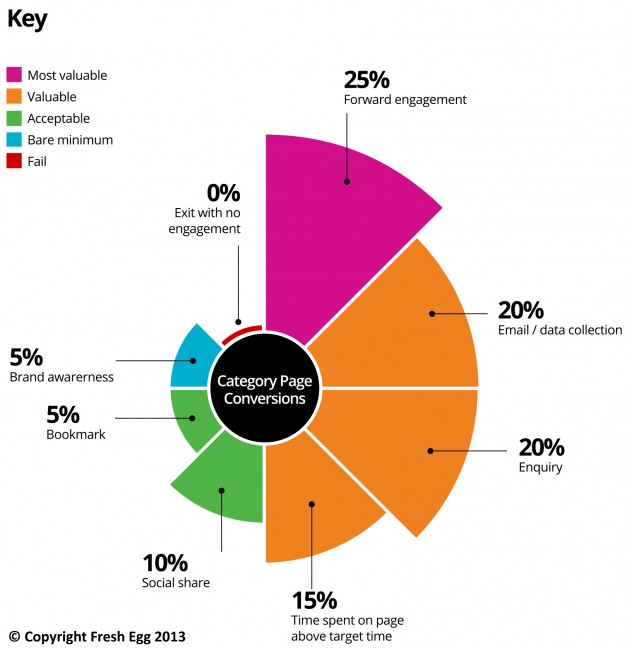
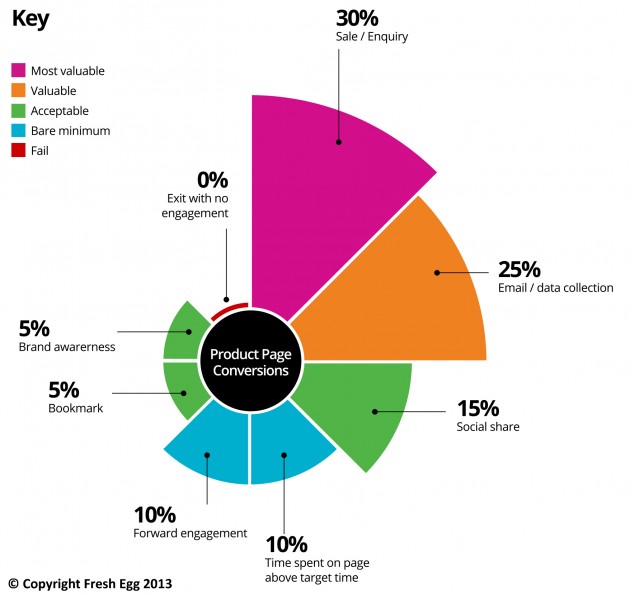
Look at the difference in page performance measurement that occurs between a category and product page. While similar, there are differences in how we would like visitors to interact with the two page types:
Category type page
Product type page
Major differences
The key differences between the two page types are:
- Category page – Forward engagement is the primary goal
- Product page – A sale or enquiry is the primary goal
If the primary goal cannot be attained, then email or data collection would be beneficial for future targeting via CRM
All of this ties in with overall performance objectives and the analytical data extracted from the likes of Google Analytics, Coremetrics etc.
What the two diagrams have in common is layered goals. If the content is not achieving the primary goal, what other metrics can be used to show a page’s value? Employing a series of failover metrics allows digital marketers to investigate what a piece of content is bringing to the table, and investigate which areas need to be improved in order to meet the primary goal.
Understanding the exit points of each page type will allow the marketing team to make decisions based upon the data. It may well be that the exit is acceptable, but only provided the page objective had been achieved.
Create your own page performance metrics with our Excel widget
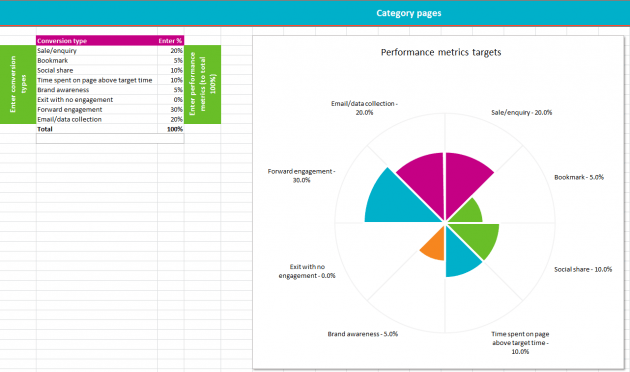
Use our widget to present your team with performance objectives on a page-by-page basis that will complement your inbound marketing efforts in ensuring that everything possible is being performed to make each visit count.
Now you need to track the actions of each page. You may want an Analytics consultant to assist you with that. If this is something we can assist with, simply get in touch with us for help.
Download our page performance widget
To help out your content team Fresh Egg has created an Excel-based widget that will enable page performance metrics to be defined for different page types. The output can then be provided as part of a content production brief for a technical team to understand what it is that has to be achieved.
Visit the Fresh Egg Resources page to download the page performance widget.